
Welcome back bloggers!
If you have not read my previous blog called “Bugs in Manhattan, Ant Picnic Field Sampling, Predation of Bird Nests, and Challenges in Urban Ecology” (long title, I know…), it might be better if you do so. This blog might be confusing otherwise.
After spending time outside and collecting all the ants that showed up on our baits, our professor euthanized them so we would be able to count up the total number. Every group did this. In the end, we would be able to have a class data set. This turned out to be very different than I expected. My group was already surprised we had 86 ants on a cookie, considering we barely had any ants anywhere else. You should’ve seen another group’s… One group counted 400 ants on a piece of cookie!
This was our class data! To make it easier to see, I cropped out some less important information like the group name, location, year, latitude, and longitude.
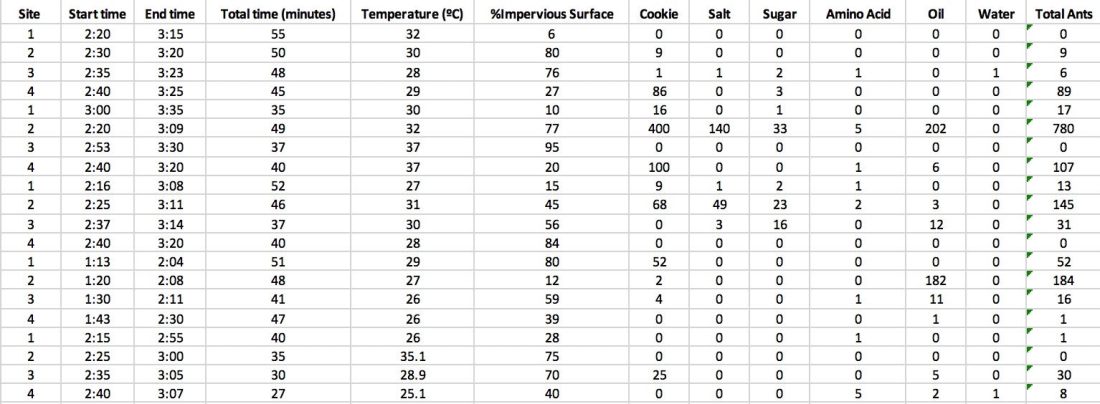
As you can see, every group had at least one site that was successful for the cookie bait. For reference, my group was the first four sites. Group two’s site 2 was most definitely liked with a whopping 400 ants on their cookie! My group on the other hand, only got a maximum of 86 ants on our cookie. This was at our site 4. We didn’t do anything wrong. It just depends on the location! Maybe there was an ant nest near group two’s site 2. Maybe their cookie was on the ant’s path. Anything could have happened for a group to obtain way different data.
Many other things affect why an ant might go for a certain type of food. The time of the day, the type of ant, the nutritional needs of the colony, the weather, etc. For example, one peer reviewed article called A Carbohydrate-Rich Diet Increases Social Immunity in Ants by Kay, Adam D., et al. states that “diet macronutrient composition affects immunity gains that arise from social grouping . . . ants in worker groups survived longer when reared on a high-carbohydrate diet than those reared on a high-protein diet”. With this being said, that doesn’t mean that every colony will be this way. According to National Geographic, more than 10,000 species of ants are known. Every species is different and could require different needs.
For the more visual people out there, here is the data portrayed by a bar graph:
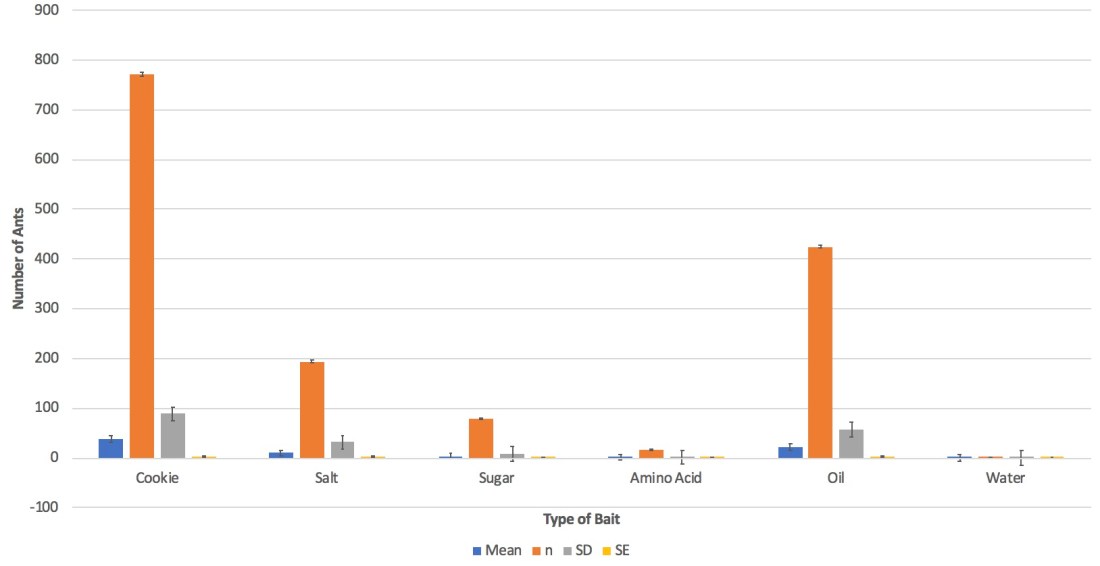
By using a bar graph, you can easily tell which baits were preferred over the other.
Cookies were liked the most, then oil, then salt, then sugar, then amino acid, and lastly water.
So it looks like there’s a statistical difference between the type of bait and number of ants right? Sadly, looking isn’t enough so we had to actually test it. We used the ANOVA test to find out if the results were significant. Here is what showed up:
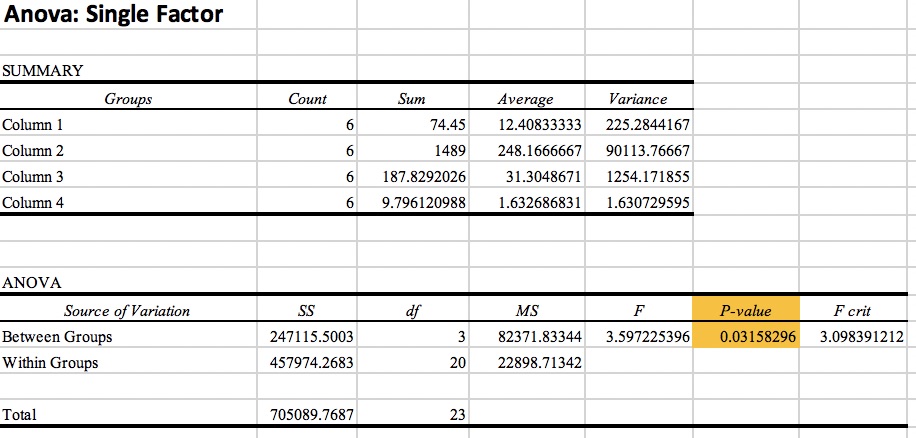
Really, the only important thing to look at is the P-value. If the P-value is below 0.05, then there is a significant difference. If it is above 0.05, then there is no statistical difference.
In this case, there is a significant difference since the P-value came out to be 0.03!
In week four, my prediction was about the same as the results we received. However, I did not see oil being the second most liked bait. Based on the previous years, I should have expected it though. However, in the year 2016, the ants really seemed to enjoy the sugar. This year, sugar was the fourth liked out of the six. Weather could have been a factor that changed the ants’ need for certain baits. Along with weather, location is everything. Even though each group should have had two sites at mostly green areas, those green areas could be near a high percentage of impervious surfaces. This can skew data really quickly.
Overall, how does visually representing data help analyze and comprehend data?
Personally, I am an auditory and visual person. So from personal experience, I know that studying a subject by using pictures or diagrams helps much more than just reading about it in a textbook. For example, videos really help me because it’s both visual and auditory. Did the bar chart above help visualize the experiment more than simply the excel spread sheet? Some people could care less about pictures and are simply auditory learners, but a lot of people need to see something to really understand it.
In ecological processes, it is very necessary to show bar graphs or any type of graph to show the different point of views. Scientists need to show the general public about problems in the environment by appealing to the audience themselves. They will not be able to do this by handing them a 200 page paper. They will most likely grab people’s attention by representing the situation visually with graphs and pictures. We really are kindergartners at heart. We just like pictures.
Of course, this is easier said than done. In my very first blog, I talked about science communication. Science is not always easy to communicate. It is very complex, especially certain subjects. However, a scientist isn’t a good scientist if he can’t explain what he’s working on to other people, easily. Though this is a tough goal to master. Since science is very complicated with many exceptions, the brief summary is not always accurate nor the best way to present something to the public. This is why it is so necessary for the general public to know the fundamental basics of science. Without it, everything is much more difficult to understand.
My advice to anyone who is joining the science field . . . do NOT slack on the basics. The basics of science should be known by everyone. An example would be the metric unit. Even though Americans don’t use this system (for some stubborn reason), the rest of the world does. It’s actually very simple to use since everything goes by tens. That’s just one of many things people should know.
So as a very brief summary: 2018 ants like cookies, my lab was statistically significant, and visual learning is very important. I hope that wrapped it up well!
Anyway, i’ll see you guys next time for my next blog! Photo by oskouioskoui
-Louanne Maes
Works Cited
“Ants | National Geographic.” National Geogrpahic, 24 Sept. 2018.
Kay, Adam D., et al. “A Carbohydrate-Rich Diet Increases Social Immunity in Ants.” Proceedings: Biological Sciences, vol. 281, no. 1778, 2014, pp. 1–6. JSTOR.
