
Welcome Welcome Welcome!
Hello fellow bloggers!
This week’s blog is about thermoregulation!
If you need a reminder, thermoregulation, according to the biology online dictionary, “[pertains} to the way organisms manage heat within them”.
For example, humans like us, are what are called endotherms. This means that we are usually slowly exchanging heat with the environment and have high metabolic rates. Of course, this is all a comparison to the opposite end of the spectrum: ectotherms. Ectotherms are usually smaller than endotherms, exchange heat rapidly with the environment, have a low metabolic rate, and usually don’t have a lot of insulation.

In the graph above, they compare a warm-blooded bobcat to a cold-blooded snake. As you can tell, the bobcat maintains a relatively stable body temperature the entire time, even if the ambient temperature increases. The snake on the other hand, drastically increases in body temperature as the ambient temperature increase. It is a very strong positive linear relationship.
My lab partner and I decided to do an experiment of our own! We wanted to compare two factors! An ectotherm (Iguana) and a endotherm (Rat). We wanted to compare these factors because their bodies work completely different from one another. We could have done something way more specific, like comparing two endotherms on different backgrounds. One endotherm could have been a lion while the other could have been monkey. The lion would have most likely gotten a yellow/orange background to blend in with it’s safari habitat, whereas the monkey would have gotten a green background to represent the leaves in a dense and green rainforest. In one peer review article titled Monkeys eat fats and carbs to keep warm, University of Sydney researchers discussed the discovery that when provided with the same foods all year round, “the monkeys ate twice as much energy in winter compared to spring. Remarkably, the additional intake in winter came entirely from fats and carbohydrates, with protein intake remaining the same”. This are other factor that could have been experimented by using thermoregulation. However, for this lab, my partner and I needed to create something way less complicated.
Of course, we didn’t have the time, nor the access, to deal with real animals. Aluminum foil, a heating lamp, a thermometer, cotton balls, and tape, would have to suffice.
We wanted to compare an endotherm to an ectotherm and look at the their heating and cooling curves after 10 minutes each. We chose animals relatively close to size; an iguana for our ectotherm and a rat for our endotherm. An iguana spends a lot of its day basking in the sun, while rats spend a lot of their days underground or hiding in dark places.


Our hypothesis was: Ectotherms will cool down quicker than endotherms.
However, before we did our experiment with our “animals”, we conducted a standardization of thermoregulation experiment. To do this, we simply took a cube of aluminum foil and put it under the heat lamp whilst having a thermometer inside the aluminum cube. We measured the initial room temperature and then continued to measure the temperature every minute until it reached a relatively stable temperature (in celsius). This took seven minutes. Voila, we had our heat curve data!
We then proceeded to the cooling curve. Right when the seven minutes ended with the heat lamp, we turned it off and recorded the temperature every minute until it stabled out. We did this for seven minutes as well.

With both of the data, we were able to create a scatter plot to show a better visual representation of our experiment. Here it is!
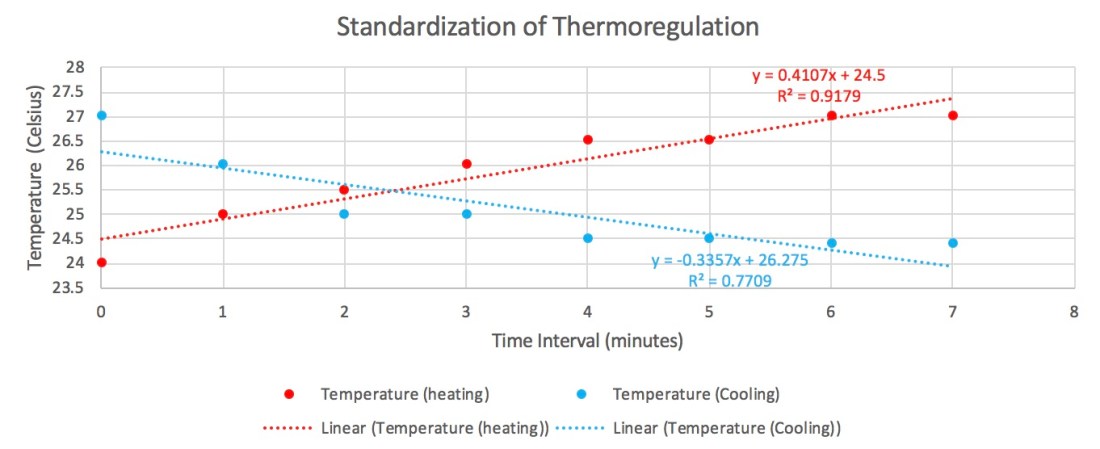
As you can see, the heating curve is positive and linear whereas the cooling curve is negative and linear.
Now on to the real experiment!
For our iguana (ectotherm), we built a a cylinder out of aluminum. We then took the room temperature as part of our data and then stuck a thermometer inside the “animal” and put the entire thing under a heating lamp. We then started taking the temperature every minute until it stabilized. It began stabilizing around 10 minutes. My partner and I also did not want to go very much above 10 minutes, in fear for not being able to finish the lab on time.
After the 10 minutes were over, we quickly turned off the heat lamp and began recording the temperature every minute for another 10 minutes. This would give us our cooling curve of our iguana. These were our results!

To make it easier to look at, here it is in scatterplot form:
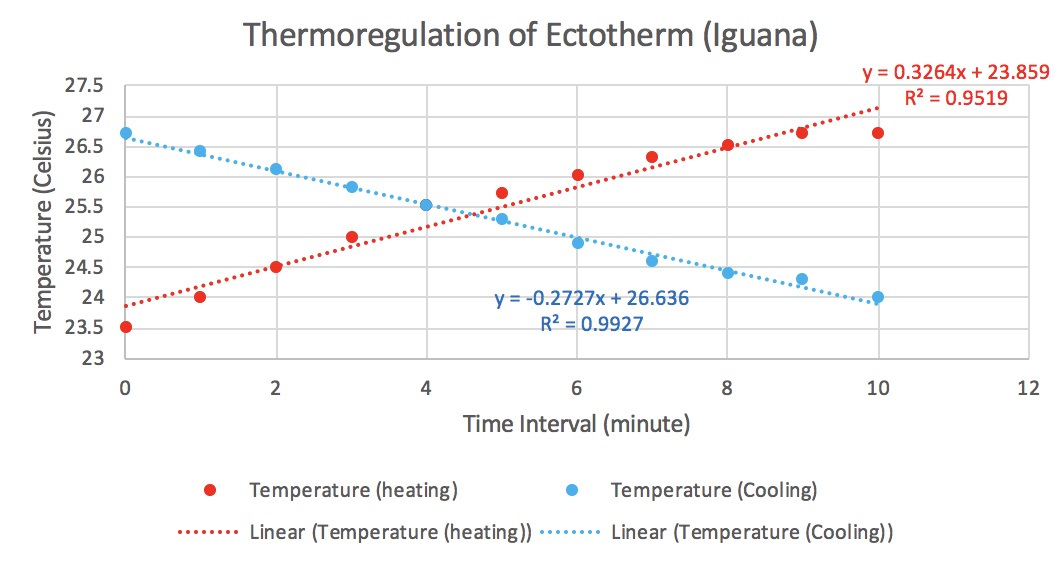
As you can see, the Iguana cooled down relatively quickly. It dropped a whopping 2.7 degrees Celsius in a matter of only 10 minutes.
Now lets see its competitor, the endotherm!
We did the exact same thing except the aluminum “animal”, our rat, was stuffed with cotton balls since it has more insolation than the iguana.
Here were our results for the rat!

Now here’s the scatterplot:
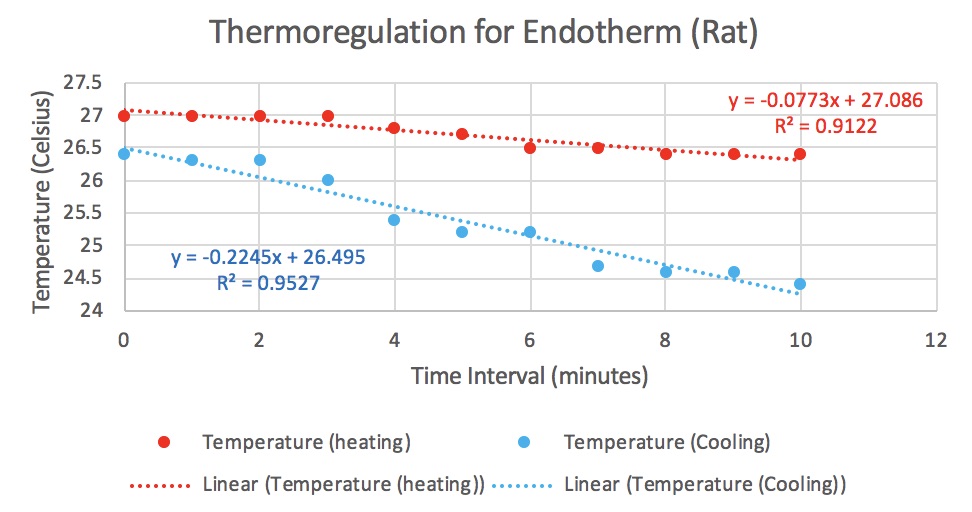
The endotherm only cooled down by 2 degrees Celsius! That’s a 0.7 degree Celsius difference between the two!
Generally speaking, by looking at the data, our hypothesis was right! However, we can’t speak generally around here. We have to speak like scientists. Since we only compared two variables, the ectotherm versus the endotherm, we are able to use a t-test.
To do the t-test, I asked excel to do a t-test equation. I did this by giving it my row of cooling data from the ectotherm and comparing it to the row of cooling data from the endotherm. After that, I also stated that it was a two-tail test. In the end, it gave me the p-value of 0.782686. OUCH. For an experiment to be significantly significant, it has to be below the p-value of 0.05. This was most definitely not the case. Though our eyes see something different, the math proves us otherwise. The difference in cooling between an Iguana and a Rat is NOT statistically significant.
Alright, lets talk about human error. We could have done things a lot better in this experiment. Firstly, the thermometer we used was a normal looking thermometer. Like this:
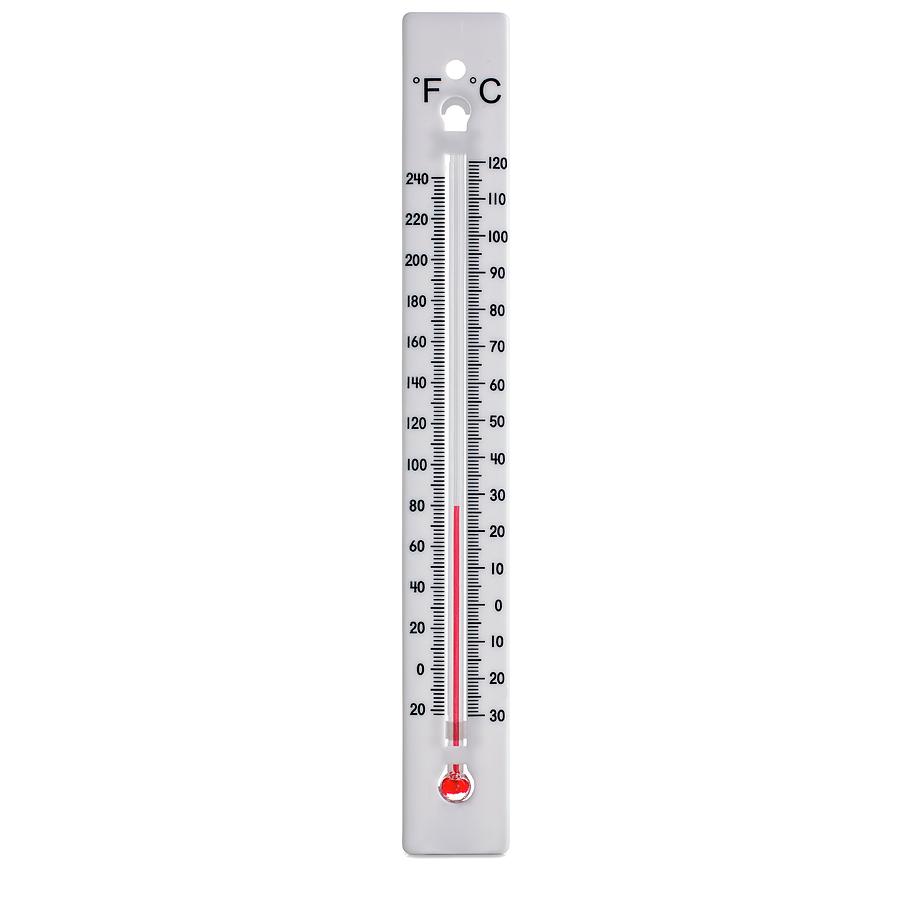 Photo by Science Photo Library
Our thermometer went by measurements of 0.5 degrees Celsius. This is not precisely accurate. Along with the significant digits, the thermometer can show a different reading based on the angle you look at it with, which eye you close, if any, etc. Even though I was the only one doing the readings in order to be a little more precise, I found it very difficult to read the thermometer clearly every time.
Another human error was the room temperature. We noticed towards the end of the experiment that our room temperature data looked a little wacky. For example, when you look at the scatterplot graph for the endotherms, you can observe that the heating curve actually lowers in temperature. This isn’t normal. Our guess is that we accidentally held the thermometer in our hand before starting the experiment. Although it did not heavily effect the results, it is still something completely wrong and out of wack with everything else. To improve this in replication, a temperature gun would be needed.
Replication of any experiment is extremely important. One experiment does not finalize a theory or hypothesis.
If we were to replicate this experiment again, we would spend way more time collecting data, use a temperature gun, and make way more precise measurements of the sizes of both of our aluminum “animals”.
While this was a fun lab, my partner and I would redo it if we could. I have a feeling we had a little too much human error and would like to do redo it properly.
As always, see you next time!

-Louanne Maes
Peer Review Citation:
University of Sydney. “Monkeys eat fats and carbs to keep warm: Golden snub-nosed monkeys adjust nutrient intake in winter.” ScienceDaily. ScienceDaily, 8 June 2018.
