Welcome back to another blog!
Today, we’ll be talking about the effects of climate change on phenology.
What is phenology may you ask?
Well… According to budburst.org, “phenology is the study of the timing of the biological events in plants and animals such as flowering, leafing, hibernation, reproduction, and migration”. To put it simply, it’s like a calendar for nature itself.
One of the biggest examples of phenology is bees and their job to pollinate flowers.
According to a study done by Jane Ogilvie, a Florida State University Scientist, “when researchers think about flower effects on bees, they typically consider floral abundance to be the most important factor, but we found that the distribution of flowers throughout a season was most important for bumble bees … The more days with good flower availability, the more bees can forage and colonies can grow, and the bigger their populations become. We now have longer flowering seasons because of earlier snowmelt, but floral abundance has not changed overall. This means we have more days in a season with poor flower availability.” So when research was actually done, an increase in flowers does not equal to a healthier life for bees. In reality, it effects them badly. In general, for anything, upsetting the balance of nature has consequences. Photo By Jon Sullivan
Let’s move on to another organism: Cicadas.
You know those bugs that are super loud? Decently big? Have huge eyes? Molt and leave shells everywhere? Seem really dumb and run into everything? Yeah… those are cicadas. Though they may not be the prettiest to look at, they are interesting creatures and fascinating to study.


Although there are annual cicadas, there are large populations of cicadas that are called “periodical” cicadas and should only come out either every 13 or 17 years depending on the species. However, recent events showed that some species of cicadas emerged four years early! Why would this happen?
Cicadas are sensitive to the temperature of the soil. As nymphs, they rely on their biological clock to tell them when they can emerge from the ground and begin their brief life. According to an article by Knvul Sheikh on the scientificamerican.com called Brood Awakening: 17-Year Cicadas Emerge 4 Years Early, “when the soil reaches 64 degrees Fahrenheit in a given year, they all emerge together. Experts think evolution has favored this strategy as a way of overwhelming predators like birds and squirrels so cicadas can mate frantically and lay eggs before they die in a few weeks”.
Normally, like stated above, it takes 13 or 17 years for the cicadas to emerge. However, due to climate change, the soil can increase in temperature way faster than usual. Thus, causing them to emerge from the ground four years (or however many years) early. This causes an imbalance in their reproductive instinct and also effects the wildlife around them. Cicadas are not harmful to humans, but according to usgs.gov, cicada “eggs are laid in slits in twigs, so during large emergences of periodical cicadas they can cause substantial damage to branches of trees and shrubs”. While this in not a ginormous problem, it still has an impact on the environment.
A phenologist has to be able to create and comprehend data in order to figure out the problems seen in the environment. Scatter plots are a heavily used form of graphing in the field. For example, I’ll show you my scatter plots from data first recorded by the United Kingdom Meteorological Office on temperatures in three cities ranging from the years 1659 to 2016.
My first scatter plot shows the mean annual temperature:
My second scatter plot shows the mean temperature from February to April:
My third scatter plot shows the mean temperature from March to May:
For all three of these scatter plots, I used “years since 1659” as my x-axis and the “average temperature (C)” as my y-axis. I did this because the independent variable tends to go on the x-axis while the dependent variable tends to go on the y-axis.
On all of my scatter plots, I also included a trend line. All of these trend lines are linear and positive. Meaning, all the scatter plots are showing that over time, the temperature is increasing. The closer the correlation is to one, the more close to perfect uphill linear relationship it is. So in my case, the scatter plot showing the mean temperature from February to April is the closest to being a perfect positive linear relationship.
In other cases, phenologists will be comparing a different type of data that relates to both plants and animals. In this next example of mine, I will show you the relationship between the peak flowering times (days since March 1st) in Early Spider Orchids (Ophrys sphegodes), the correlation it has to the first flight of the Solitary Bee (Andrena nigroaenea), and the mean temperature from the years 1848 to 2017.
Scatter plot showing the correlation between peak flowering times, the first flight of bees, and the mean temperature:
This scatter plot clearly shows the beginning and the end of each variable. For example, if I were to look at 7 degrees Celsius, I could tell you that the peak flowering time is still on going while the first flight of bees has pretty much ended. At 10 degrees Celsius, I could tell you that the peak flowering time had just ended but that the first flight of bees ended 2 degrees ago. Plots like these help visualize the problem rather than just stating the problem with words.
Along with scatter plots, bar graphs with error bars are also another way to look at the issue. My bar graph specifically looks at comparing peak flowering times and the years, along with bees first flight and the years.
Relationship Between Peak Flowering Time and Years:
Relationship Between Bees First Flight and Years:
In the beginning of the century (1848-1900), both the bee activity and flowering times are very similar. However, near the end of the century (1954-2006), peak flowering time is higher than bee activity. The phenological consequence would be huge if the flowers kept blooming too early or too late regarding the first flight of bees. Bees would have less reproductive success.
Overall, phenology is clearly an important field that needs to be studied constantly in order to predict or currently see the issues in our environment. However, before the issue is even an issue to begin with, the elephant in the room needs to be addressed: Climate change.
Climate change, according to UC Davis, “refers to significant changes in global temperature, precipitation, wind patterns and other measures of climate that occur over several decades or longer”. While this has become a much more popular topic recently, thanks to science, it is still an ongoing and pressing issue that some people still refuse to believe.

Some people refuse to believe in climate change because of political stubbornness. Politics have torn people in two and now logic is being set aside. Other people have trouble trusting science. According to Aeon, a digital magazine, they have four predictors of either science acceptance or science skepticism: “political ideology; religiosity; morality; and knowledge about science”. Some of these predictors are most likely to correlate as well. For example, a person who is conservative in ideology has a higher chance of also having a religious reasoning.
It is hard to communicate to the public about climate change for these reasons. Not everyone thinks the same way and other factors effect people’s beliefs. There is no one solution to address this challenge. Science can only be presented in so many ways. However, subjects could be presented in such a way to grab the audience’s attention. Like my previous blog about science communication, it is all about connecting with the audience on their level of knowledge and interests.
To start talking about climate change, scientists or simply passionate individuals can discuss the consequences of climate change on the general public. For example, according to a peer reviewed journal by Ciscar, Juan-Carlos et al. called Physical and Economic Consequences of Climate Change in Europe, the authors discuss river flooding, tourism, human health, and the impact on the overall economy.
In their discussion about river flooding, they state that “river floods are the most common natural disaster in Europe, resulting in large economic losses through direct damage to infrastructure, property, and agricultural land and through indirect losses within flooded areas and beyond … Global warming generally is expected to increase the magnitude and frequency of extreme precipitation events, which may lead to more intense and more frequent river floods”.
When talking about tourism, the authors state that “climate change has the potential to alter tourism patterns in Europe radically by inducing changes in destinations and seasonal demand structure”. For example, if a bunch of coral reefs are dead off the coast of France, who would want to go there? People go to specific destinations for scenery and if those destinations are no longer pretty enough to people’s standards, they will receive less tourism.
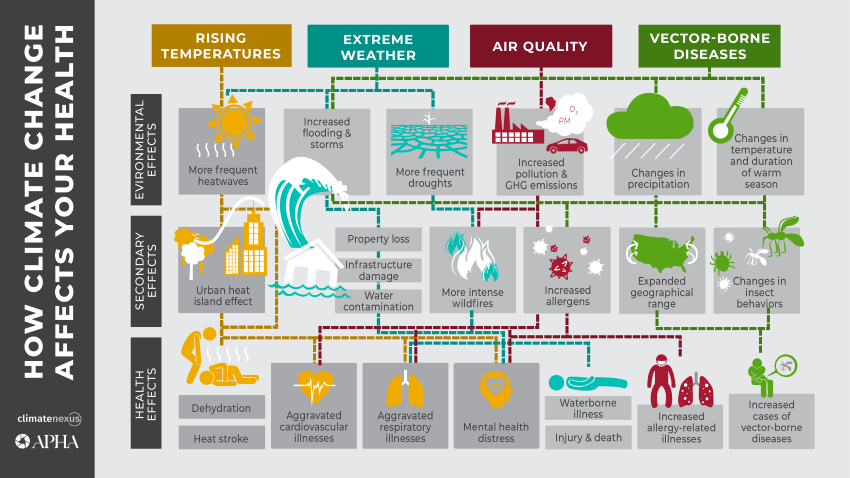
Human health is also a huge factor when discussing climate change. According to the journal, “climate change has a range of complex interlinkages with health, including direct impacts, such as temperature-related illness and death and the health impacts of extreme weather events. Other impacts follow more indirect pathways, such as those that give rise to water- and food-borne diseases, vector-borne diseases, or food and water shortages”. In developing countries, this can be a very deadly issue.
Last, but most definitely not least, is the impact of the overall economy. Everything mentioned already, like river flooding, tourism, and human health can be linked somehow and over time, effect the overall economy. When the economy is in a bad place, it is very hard to get out, especially if you are dealing with an issue as severe as global warming.
To end this blog, I would like to reiterate the importance of both phenology and climate change and how they interconnect with each other. While science may not be everyone’s favorite subject, this is not just another mere fact that you can ignore and never remember again. This is part of our lives. Our daily actions are effecting the environment and thus creating a chain reaction to everything else.
I encourage you to learn more about your footprint on this earth and how we can help the planet from going in ruins at the cause of our own hands. We are one, if not the most intelligent species on this planet. If we figured out everything we currently have today, we can most definitely help fix this place we call home.

Until next time!
-Louanne Maes
