Welcome back to part 2 of the plant dispersion blog!
In this blog, I’ll mostly be talking about the calculated results obtained from part 1!
As a reminder of what is going on, here is a summary . . .
My classmates and I were out in a cemetery on campus counting Dallisgrass (Paspalum dilatatum) using home-made 1m^2 quadrats and randomly generated numbers as our steps. We recorded 15 quadrats and predicted what kind of dispersion it would represent (clumped, normal, or random). I predicted that it would be a clumped dispersion. Let’s see what the calculations say!
This is what the graph is supposed to look like for the corresponding dispersion!
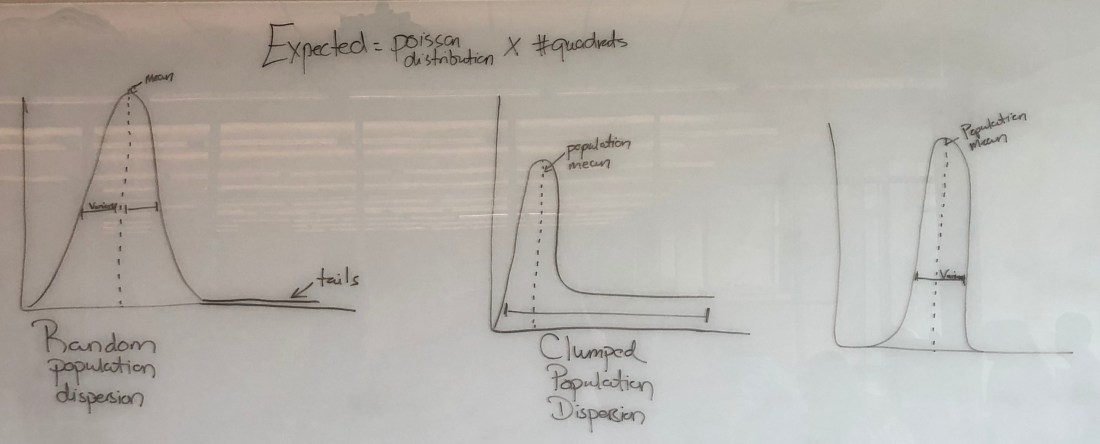
Drawing by my professor
My group and I surprisingly recorded a lot of zeros in our data, whereas the remainder of the class did not seem to record a lot of zeros. This could have simply been due to the different random locations each group went to, or it could have been due to a different way of counting the Dallisgrass plants. These possibilities need to be remembered when looking at the results because a lot of human error could be present.
In our results, we worked with Poisson Distribution. According to statisticshowto.datasciencecentral.com, poisson distribution “is a tool that helps to predict the probability of certain events from happening when you know how often the event has occurred. It gives us the probability of a given number of events happening in a fixed interval of time”. Excel helped me calculate this of course.
In the end, our goal was to have the observed vs expected values, and our chi-squared test. According to statisticsolutions.com, a chi-squared test “is a test that involves the use of parameters to test the statistical significance of the observations under study”.
We first started off calculating the results with just my group so we could then later compare it to the whole class.
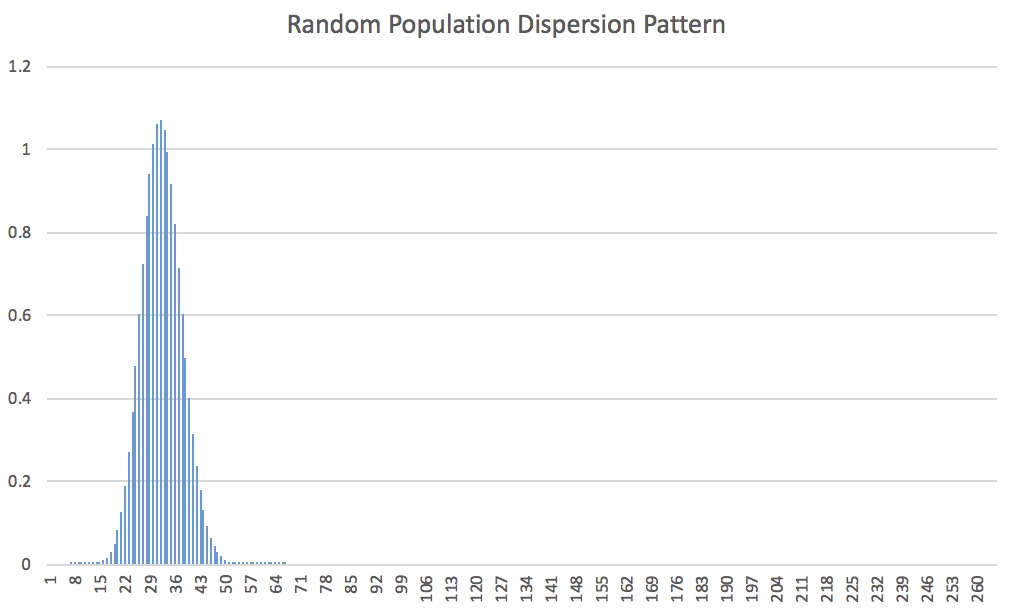
This was my group’s expected dispersion:
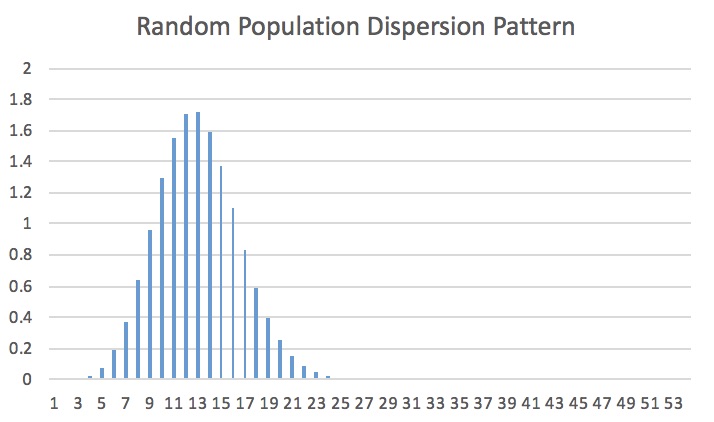
As per not only the title, but also the previous reference from my professor’s drawings, we can tell that this is a random dispersion.
So, this tells us that the expected dispersion is random. But does that mean our observed results will turn out to be random?
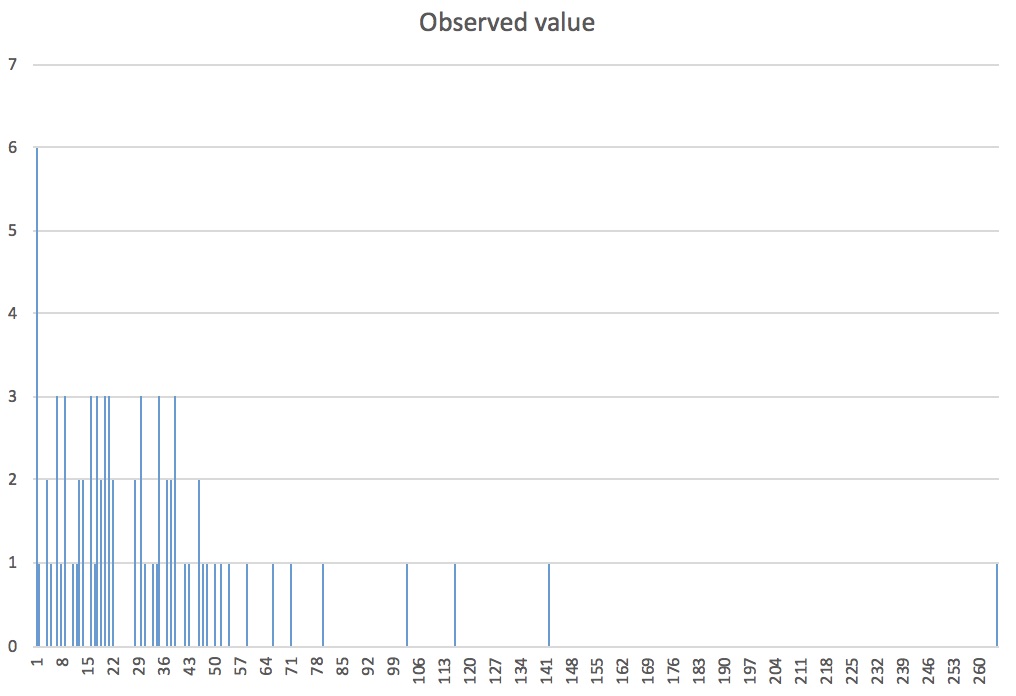
Well . . . Let’s look at the observed results next!
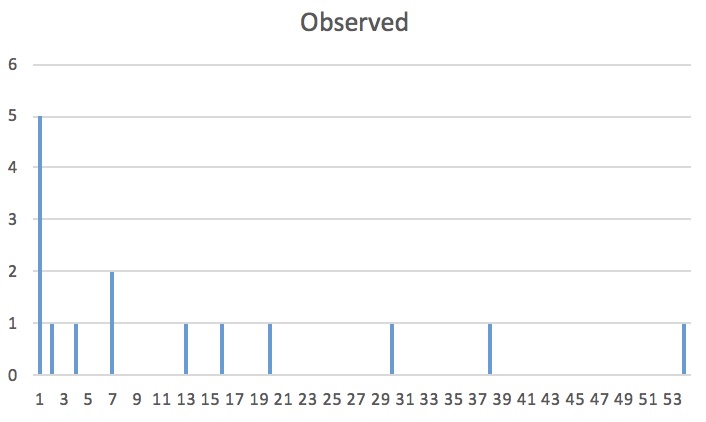
Wow . . . Yeah, our observed results are most definitely not random. Look at that tail on the graph! If you look back at the reference picture, it is clearly a clumped population! Our prediction was right!
Now to look at the chi-squared value! After telling excel to do the sum of the (observed-expected)^2 divided by expected, it gave me 2.35067E+16! That is a pretty big number . . .
However, we have to look at a chi-squared chart and know our degree of freedom and p-value to find out if this is statistically significant or not.
To find out the degree of freedom, you have to (subtract the number of rows by one) and then multiply that by the (number of columns minus one). So for example, my groups degree of freedom would be (54-1) * (2-1). So, 53 * 1 = 53.
Look at the table below to find out the p-value!
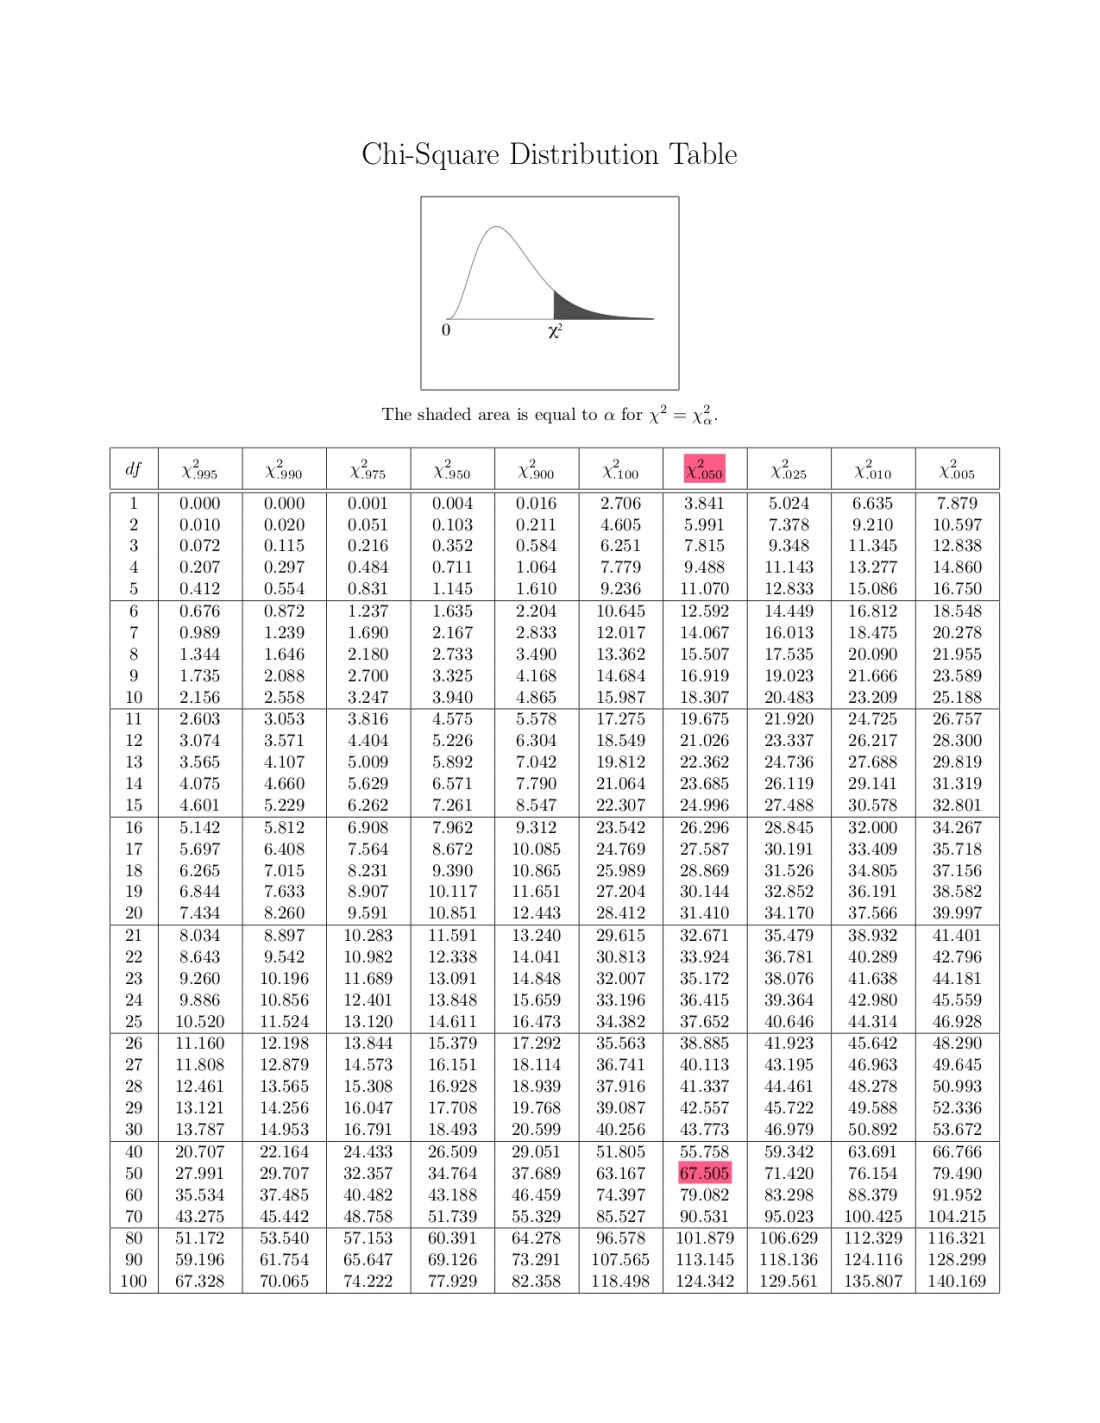
Table given by my professor
As you can see from above, our p-value turned out to be 67.505. Compare this to the chi-square value given to you from excel.
67.505 vs 2.35067E+16
Our p-value is highly significant! Look at the difference between those two numbers!
We can officially conclude that our plant recordings were not due to random variation!
Now that we’ve got my group figured out, let’s compare it to the whole class!
The concept is the same. They only difference is that it was a way bigger data set.
One of the groups found as many as 264 plants in a quadrat! Since this was the highest number out of all groups, we needed to use this as our base.
After the same calculations then before, these were our results!
Here is the expected dispersion for the entire class:
There is a slight tail at the end, so it is still considered a random dispersion.
But again, does this mean that the observed will turn out to be random as well?
Let’s check!
Here is our observed dispersion:
Once again, the dispersion is clumped!
But . . . we still have to check the chi-square test.
Excel gave me 6.1488E+143.
Once again, we need to find the degree of freedom and look at the table.
(265-1)*(2-1) = 264*1 = 264
Since this is such a high value, the chi-square tabled does not even go that high. So, we’ll just use 100, the highest number it will give us.
124.342 is the value the chart gives us. Now we have to compare that to the excel number.
124.342 vs 6.1488E+143
Again, we’re highly significant! We can clearly conclude that the entire class’s plant recordings were not due to random variation.
What does this tell us about Dallisgrass? Why is it clumped like this? What factors influence Dallisgrass growth and fitness?
According to a peer reviewed article called Forage Yield, Nutritive Value, and Grazing Tolerances of Dallisgrass Biotypes by Venuto, B. C., et al. Dallisgrass is believed to have originally come from Uruguay and “is distributed throughout the southeastern USA and is widely used for permanent pastures (Burson and Watson, 1995). The species is best adapted to areas receiving at least 900 mm of annual rainfall and grows well on clay or loam soils that are moist but not flooded. It initiates spring growth earlier than most warm-season perennial grasses and generally persists later into the fall (Holt, 1956). The species survives well under heavy grazing and has excellent forage nutritive value when properly managed (Holt, 1956)”.
So . . . If you keep that into consideration, maybe we can find Dallisgrass’s weaknesses. It needs rainfall and moist grounds, so it would probably not thrive in a desert. They say it survives well under heavy grazing, but would it survive well under heavy stomping? Maybe it could not grow well in a field that is commonly stomped on by animals.
They might seem like a really tough plant, and they are compared to most others, but they are not invincible.
However, Dallisgrass is excellent at producing an abundant amount of seeds. These numerous amounts of seeds can easily be transported by water, wind, animals, etc. But can they go very far? According to a science magazine article called ‘This is amazing!’ African elephants may transport seeds farther than any other land animal by Erik Stokstad, African elephants were able to transport seeds as far as 65 kilometers! The seeds are within the elephant’s digestive system and get excreted between 33 and 96 hours later! Transportation of this degree allows for an amazing amount of genetic diversity between plants in the Savanna.
If you compare the dispersion of seeds in the savanna versus Dallisgrass seeds, I personally do not think they are the same. I would assume that the dispersion of seeds in the savanna is random, whereas we already proved that the dispersion of Dallisgrass was clumped.
Anyway, I hope that those results were interesting. Dallisgrass seems to be a hell of a plant that can go through a lot and continue thriving relatively easily.
I’ll see you next time!

-Louanne Maes
Peer Review Citation:
Venuto, B. C., et al. “Forage Yield, Nutritive Value, and Grazing Tolerance of Dallisgrass Biotypes.” Crop Science, vol. 43, no. 1, 2003, pp. 295-301.
